I don’t know how Tim Eller, spokesman for the state Department of Education, can keep a straight face when he talks to reporters. Again and again he declares that Governor Corbett “has increased state funding for public schools by $1.5 billion” over the past four years. [Post-Gazette, 8-28-14]
Anyone with half a brain or with a school age child can tell you that’s a load of hogwash. Sometimes having school age children makes us parents operate with only half a brain, but we can still tell you that Pennsylvania kids are sitting in larger classes, with fewer of their teachers, and missing critical books, supplies, academic courses, and programs.
Of course, what Mr. Eller means is that Gov. Corbett collapsed a bunch of line items into the Basic Education Funding portion of the budget, so that he could say that this single line item increased. Meanwhile, he decimated overall state funding for public schools. Gov. Corbett also likes to tout the additional dollars he put into pension payments (as required by state law) when he calculates that $1.5 billion figure, but will not account for the fact that he slashed charter school tuition reimbursements for districts, Accountability Block Grants, School Improvement Grants, or other programs such as the Education Assistance and High School Reform programs.
As the following graph clearly illustrates, even allowing for increased state contributions to pension payments, our schools are still not receiving the level of preK-12 funding that they were back in 2008-09! (In this chart the federal stimulus dollars are in yellow and pension dollars in light blue: check out the dark blue columns to see how our schools have been set back more than six years in budget cuts.)
But this is more than a rhetorical debate over which line items to count. Four years into this mess it is now clear that these historic budget cuts have hurt our poorest students the most. A new report out this week analyzes state funding per child and finds that budget cuts to the most impoverished school districts were more than three times as large on average as those made to the wealthiest districts. What’s more, using the state’s own data, the report demonstrates that class sizes increased more in high poverty districts and that reading and math scores declined the most for students living in poverty. [Budget cuts, student poverty, and test scores: Examining the evidence, PSEA August 2014] Look at the disparity in chart form:
[Source: PSEA, 8-25-14]
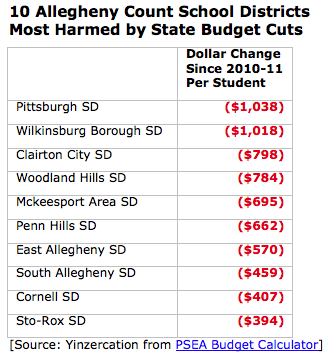
What does that look like here in Southwest Pennsylvania? Just look at the following table of the ten biggest losers in Allegheny County on a per-student basis. Pittsburgh tops the list of districts most harmed by budget cuts with an average per-child loss of $1,038, followed by a parade of high-poverty school districts. It’s worth noting the story of race here, too, as these districts have a large proportion of students of color. Compare these numbers to Fox Chapel, which has “only” lost $36 per student (no students should be losing money for their education), or Mt. Lebanon ($9), or my alma mater, Upper St. Clair, which has actually gained $4 on a per-student basis.
Perhaps Gov. Corbett should spend more time explaining why his policies are hurting poor kids than trying to convince us that he has increased spending on public education. We parents just aren’t that gullible.


